Image Details
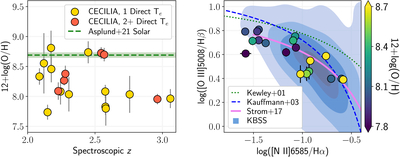
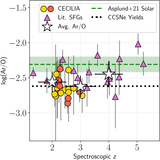
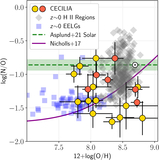
Caption: Figure 6.
Left: direct gas-phase O/H vs. z measured in 19 CECILIA galaxies. The color of the circles represents the number of direct Te measured in each galaxy: red circles have two or more direct Te; yellow circles have a single Te. The solar O/H ratio is plotted as a dashed green line and shaded area. While the highest-z galaxies tend to show low O/H, several CECILIA galaxies show gas-phase O/H consistent with the solar ratio at z ≳ 2. Right: the N2-BPT is reproduced with the Te sample, color-coded by 12 + log(O/H). The CECILIA sample follows the expected trends in this relation: galaxies with low [N II]/Hα and high [O III]/Hβ exhibit relatively low O/H, and O/H increases with [N II]/Hα as [O III]/Hβ decreases.
Other Images in This Article
Show More
Copyright and Terms & Conditions
© 2026. The Author(s). Published by the American Astronomical Society.