

Image Details
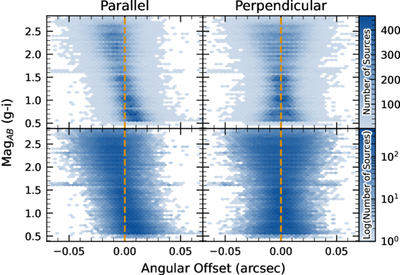
Caption: Figure 26.
Visualization of DCR observed in the LSSTComCam commissioning campaign. The g − i color is computed for every source in the reference catalog (Section 3.3.3) that is matched to a direct source in the science image, and the binned density for the full survey is plotted against the angular offset between the reference and detected positions. The angular offset is projected along coordinates parallel and perpendicular to the parallactic angle of the observation, and shows a characteristic correlation along the parallel axis with no correlation along the perpendicular axis. The orange vertical dashed line indicates the expected g − i distribution at zero angular offset.
Other Images in This Article

Show More
Copyright and Terms & Conditions
© 2026. The Author(s). Published by the American Astronomical Society.

