Image Details
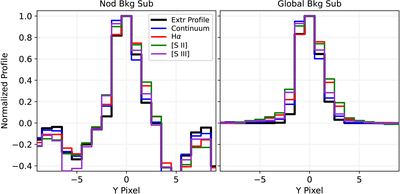
Caption: Figure A1.
Emission in the spatial direction of the 2D NIRSpec data of the galaxy BX474. The profiles are normalized by the peak emission measured in the center row. The left and right panels compare the profiles obtained from the nod and global background subtraction approach, respectively. The spatial profiles plotted are Hα (red), [S II] λ6718 (green), [S III] λ9533 (purple), the stellar continuum (blue), and the optimal 1D extraction profile determined from MSAEXP (black). The nod background-subtracted data show self-subtraction residuals in both the continuum and emission lines, while the global background method described in Section 2.4 conserves the extended emission.
Other Images in This Article
Show More
Copyright and Terms & Conditions
© 2026. The Author(s). Published by the American Astronomical Society.