

Image Details
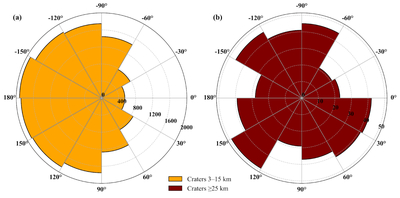
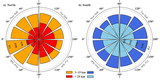
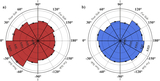
Caption: Figure E1.
Rose diagram showing the longitudinal distribution of north polar craters. Orange bars represent craters with diameters of 3–15 km (panel (a)), while brown bars represent craters with diameters ≥25 km (panel (b)). The radial axis indicates the number of craters within each 30° longitude bin.
Other Images in This Article
Show More
Copyright and Terms & Conditions
© 2026. The Author(s). Published by the American Astronomical Society.

Copyright ©
2026 Astronomy Image Explorer. All Rights Reserved.
