

Image Details
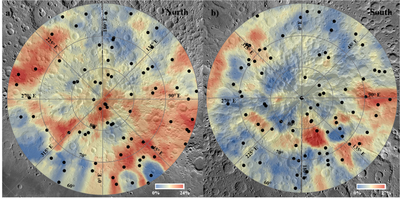
Caption: Figure D1.
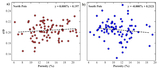
Crustal porosity maps of the lunar (a) north and (b) south poles (D. Wahl et al. 2020), overlaid on the LROC Wide Angle Camera (WAC) polar mosaic. The color scale represents crustal porosity (in %), with warmer colors indicating higher porosity and cooler colors indicating lower porosity. Black circles mark the locations of fresh craters, which are used to examine the relationship between crater d/D and target terrain porosity.
Other Images in This Article
Show More
Copyright and Terms & Conditions
© 2026. The Author(s). Published by the American Astronomical Society.

Copyright ©
2026 Astronomy Image Explorer. All Rights Reserved.
