

Image Details
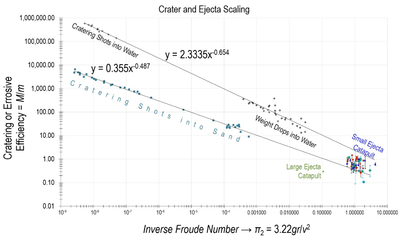
Caption: Figure 9.
The data for our small ejecta experiments in Earth (cyan), Mars/Mercury (red), and Moon (dark blue) gravity are plotted between the curves for impacts (or dropped weights) into water (top) and sand (bottom). There are fewer ejecta-related data points here than in Figure 8 because while every ejecta curtain can have a π2 calculated for it, not every curtain results in measurable (or any) erosion; to wit, some experiments lack or have minimal regolith for the ejecta to erode. Reanalyzed ejecta data from the large catapult (K. D. Runyon & O. S. Barnouin (2018) appear in green near the bottom. π2 data are unavailable for the two new shots with the large, ground-based catapult with M/m values in Figure 7.
Other Images in This Article
Show More
Copyright and Terms & Conditions
© 2026. The Author(s). Published by the American Astronomical Society.

