

Image Details
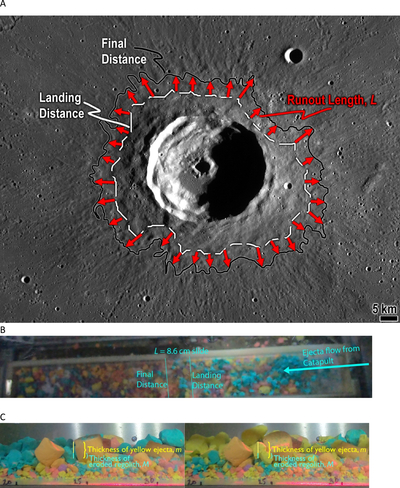
Caption: Figure 2.
(A) Cartoon illustrating and defining ejecta landing distance, runout length, and final distance. (Image is of Timocharis Crater, Moon, g = 1.6 m s−2.) The dark solid line is the approximate extent of the continuous ejecta deposit, in our interpretation. The dashed line is the supposed landing position of the same ejecta. The red arrows denote the length L that the ejecta slid before coming to rest. In our ejecta emplacement experiments, parcels of regolith may be tracked to measure L directly. Lunar Reconnaissance Orbiter Wide Angle Camera spacecraft image credit: NASA via QuickMap. (B) A top-down view of a catapult experiment illustrating the definition of runout length, L. We visually tracked the top of the densest part of the curtain to where it both landed and came to a stop. Distances are approximate due to the diffuse nature of ejecta curtains. The ejecta is cyan-colored in this experimental shot. (Still frame from experiment and camera view Flight 2, Lunar 6, Overhead.) (C) Example of measuring erosive efficiency with a “before” image (left) and an “after” image (right); yellow ejecta flow is left to right. The thickness of the deposited ejecta, m, is shown (see yellow curly brace) along with the depth of the eroded regolith, M (smaller cyan curly brace). The eroded regolith has been displaced downrange and compressed downward between the left and right frames. The numbered fiducial markings are in centimeters from the catapult, and these were used to calibrate the pixel length of the thicknesses into physical lengths. Since we measured grains that were very close to or pressed against the glass, we consider out-of-plane erosion and deposition to be minimal. (Still frames from experiment and camera view Flight 2, Lunar 7, Proximal-2).
Other Images in This Article
Show More
Copyright and Terms & Conditions
© 2026. The Author(s). Published by the American Astronomical Society.

