

Image Details
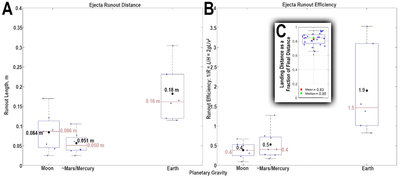
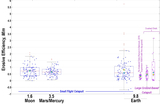
Caption: Figure 6.
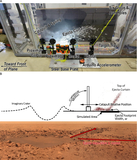
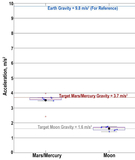
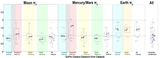
(A) Runout lengths (i.e., sliding distance from ejecta impact to where the ejecta stops) do not show a clear trend from Moon to Mars/Mercury to Earth gravity; runout lengths overlap and are similar between Moon and Mars/Mercury gravity, but the mean, median, and range of runout are substantially higher under Earth gravity. (B) Runout efficiency (1/R = 2gL/v2) increases with gravity, even as runout length does not conclusively show such a relationship. Here, average gravities achieved on the airplane for each planet are Moon ∼1.6 m s−2; Mars/Mercury ∼3.5 m s−2; and Earth (not conducted on the airplane; small flight catapult results only) = 9.8 m s−2. See gravity measurements in Figure 3. (C) The landing distance-to-runout distance ratio spans between about 0.6–0.95 with a mean of 0.83 and a median of 0.85. The distances are measured from the base of the catapult. This landing-to-runout ratio is most applicable to the region around our measurement position between the continuous and discontinuous ejecta and does not seem to vary as a function of gravity based on our experimental results. Compare the difference in landing to final distance with the runout cartoon shown in Figure 2. (The box-and-whisker plot shows the middle 50% of data (i.e., the interquartile range from the 25th–75th percentiles), the whiskers show the data range less the outliers, and the furthest outliers are shown in red +’s. The red lines and black dots denote the median and mean of each dataset, respectively. The x-axis is semiquantitative; horizontal data spread within a box is only to enhance readability and does not indicate a variation in x-axis value).
Other Images in This Article
Show More
Copyright and Terms & Conditions
© 2026. The Author(s). Published by the American Astronomical Society.

