

Image Details
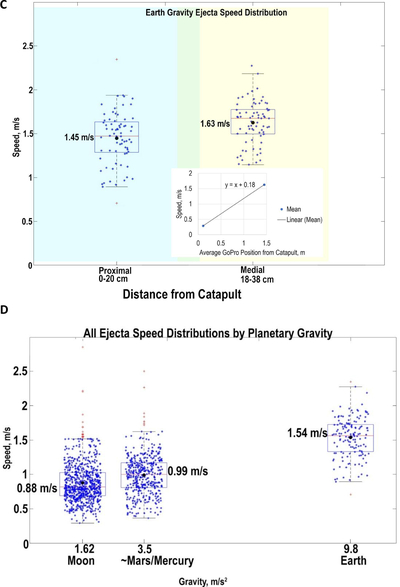
Caption: Figure 4.
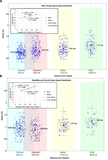
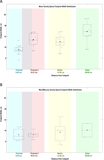
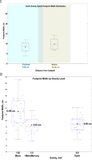
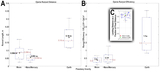
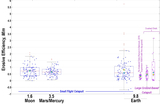
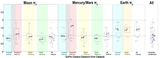
Box-and-whisker plots showing the spread of ejecta speeds (from just the small flight catapult) in (A) Moon gravity; (B) Mars/Mercury gravity; (C) Earth gravity; and (D) all gravity levels, but without regard for catapult distance. The boxes show the 25th–75th percentiles, and the error bars denote the data range, excluding outliers. The horizontal spread in blue data points for each gravity level is for clarity in presentation of individual data points and should not be interpreted to indicate variations in gravity. The colored bands in (A)–(C) correspond to the GoPro camera fields of view, and the speed data represent the range of ejecta velocities measured in that distance range; note that Proximal and Proximal-2 overlap between 15 and 25 cm from the catapult, and some grains were likely counted in both “bins.” The black speed labels refer to the mean speeds, whereas the red lines indicate median speeds. The inset plots show mean and median ejecta velocities as functions of catapult distance; note that the proximal camera data has been omitted from the Mars/Mercury gravity plot. Panel (D) shows all ejecta speeds clustered by gravity level. Note that the Mars/Mercury gravity level of 3.5 m s−2 is a measure of the average acceleration in the airplane despite true Mars/Mercury gravity being 3.7 m s−2. (The box-and-whisker plot shows the middle 50% of data (i.e., the interquartile range from the 25th–75th percentiles), the whiskers show the data range less the outliers, and the furthest outliers are shown in red +’s. The red lines and black dots denote the median and mean of each dataset, respectively. The x-axis is semiquantitative; horizontal data spread within a box is only to enhance readability and does not indicate a variation in x-axis value).
Other Images in This Article
Show More
Copyright and Terms & Conditions
© 2026. The Author(s). Published by the American Astronomical Society.

