

Image Details
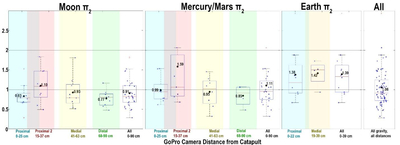
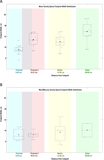
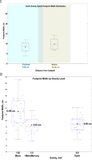
Caption: Figure 8.
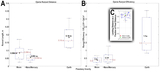
Generally, π2 = 3.22gwv–2 decreases with catapult distance and increases with gravity. (Data from small flight catapult shown.) Minor exceptions to this trend include an increase between the positions “Proximal” and “Proximal-2,” though these regions overlap, leading to possible double-counting. Note the clustering of data around order of unity. (The box-and-whisker plot shows the middle 50% of data (i.e., the interquartile range from the 25th–75th percentiles), the whiskers show the data range excluding the outliers, and the furthest outliers are shown in red +’s. The red lines and black dots denote the median and mean of each dataset, respectively. The x-axis is semiquantitative; horizontal data spread within a box is only to enhance readability and does not indicate a variation in x-axis value).
Other Images in This Article
Show More
Copyright and Terms & Conditions
© 2026. The Author(s). Published by the American Astronomical Society.

