

Image Details
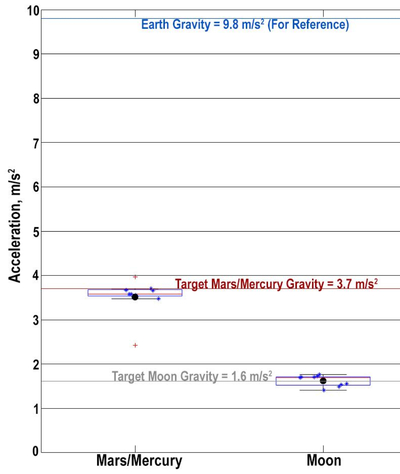
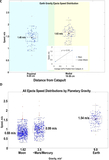
Caption: Figure 3.
Box-and-whisker plots for measured gravity levels on the airplane during “Mars/Mercury” parabolas and “Moon” parabolas. The Mars/Mercury mean gravity of 3.5 m s−2 was a bit lower than the target gravity level of 3.7 m s−2 (horizontal red line). However, the mean Moon gravity measured on the plane of 1.6 m s−2 matched the target gravity level (horizontal gray line). (The box-and-whisker plot shows the middle 50% of data (i.e., the interquartile range from the 25th–75th percentiles), the whiskers show the data range less the outliers, and the furthest outliers are shown in red +’s. The red lines and black dots denote the median and mean of each dataset, respectively).
Other Images in This Article
Show More
Copyright and Terms & Conditions
© 2026. The Author(s). Published by the American Astronomical Society.

