Image Details
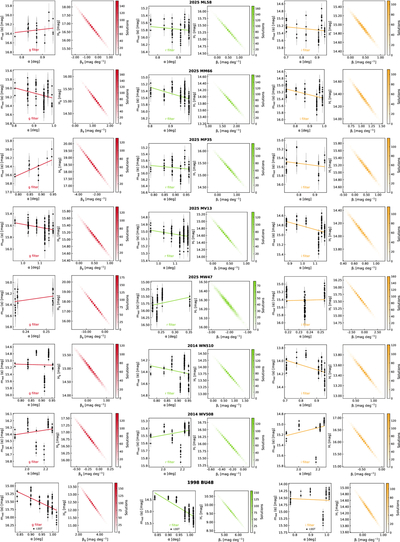
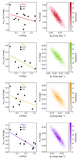
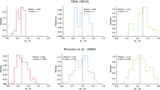
Caption: Figure 14.
Phase-curve fits for LSST TNOs across different filters. Each pair of panels shows, from left to right, the observed reduced magnitudes vs. phase angle with the median linear fit and the Monte Carlo distribution. The narrow distributions reflect the limited magnitude span of the current LSST data; objects with few observations are therefore only weakly constrained.
Other Images in This Article
Show More
Copyright and Terms & Conditions
© 2026. The Author(s). Published by the American Astronomical Society.
Copyright ©
2026 Astronomy Image Explorer. All Rights Reserved.