Image Details
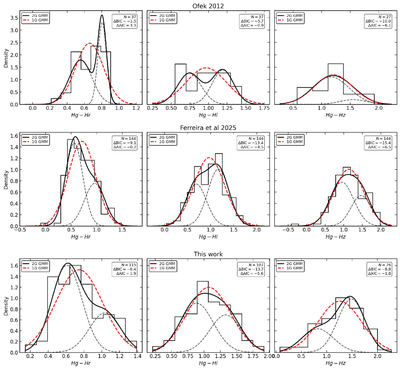
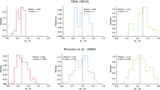
Caption: Figure 9.
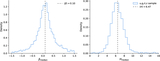
Comparison of color distributions and GMM fits for three datasets: E. O. Ofek (2012; top), F. S. Ferreira et al. (2025; middle), and this work (bottom). In each panel, the histogram shows the observed distribution, while the dashed red and solid black curves correspond to the one-component (1G) and two-component (2G) GMM fits, respectively. The individual Gaussian components of the 2G model are shown as dashed black lines. The values of ΔBIC and ΔAIC are reported in each panel, defined as ΔBIC = BIC(1G) − BIC(2G) and ΔAIC = AIC(1G) − AIC(2G), such that negative values indicate a preference for the single-component model. N denotes the number of objects in each sample.
Other Images in This Article
Show More
Copyright and Terms & Conditions
© 2026. The Author(s). Published by the American Astronomical Society.