Image Details
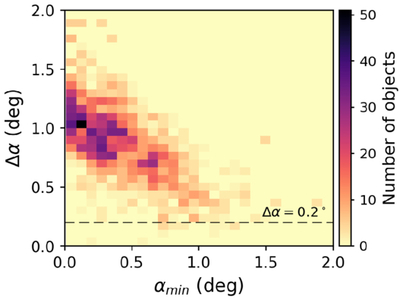
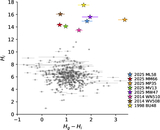
Caption: Figure 2.
Phase-angle coverage for the filtered TNO sample used in the analysis (see Section 4 for details on the selection criteria) The x-axis shows the minimum observed phase angle, ﹩{\alpha }_{{\rm{\min }}}﹩, and the y-axis shows the phase-angle range, ﹩{\rm{\Delta }}\alpha ={\alpha }_{{\rm{\max }}}-{\alpha }_{{\rm{\min }}}﹩. The color scale indicates the number of TNOs in each bin. The horizontal dashed line at Δα = 0﹩\mathop{.}\limits^{\unicode{x000b0}}﹩2 indicates the threshold adopted to identify objects with sufficiently large phase-angle coverage.
Other Images in This Article
Show More
Copyright and Terms & Conditions
© 2026. The Author(s). Published by the American Astronomical Society.
Copyright ©
2026 Astronomy Image Explorer. All Rights Reserved.