Image Details
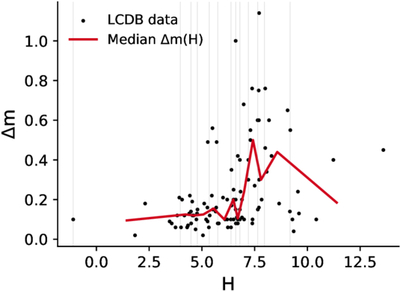
Caption: Figure 3.
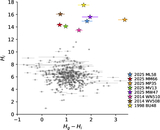
Median rotational amplitude as a function of absolute magnitude. Black points show individual TNO amplitudes reported in the LCDB, while the red line represents the median Δm(H) curve obtained by binning the data into 13 bins containing equal numbers of objects; horizontal segments indicate the H range spanned by each bin.
Other Images in This Article
Show More
Copyright and Terms & Conditions
© 2026. The Author(s). Published by the American Astronomical Society.
Copyright ©
2026 Astronomy Image Explorer. All Rights Reserved.