Image Details
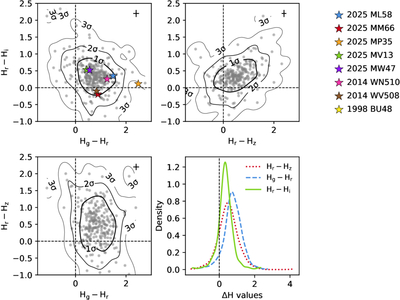
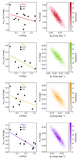
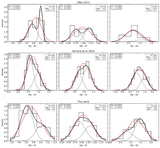
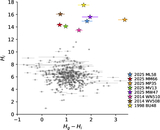
Caption: Figure 6.
2D and 1D distributions of absolute magnitude differences between filters (absolute colors). Top and bottom left panels: scatterplots with 2D KDE contours showing the correlations between ΔH values for different filter combinations. Contours indicate the 1σ, 2σ, and 3σ levels. The error plus sign shown in each 2D panel represents the average uncertainties, computed as the mean values of σΔH for the corresponding filter combinations. Colored stars highlight objects observed by Rubin, including both recent discoveries and previously known targets. Bottom right panel: 1D KDE distributions for ΔH values in all relevant filter combinations.
Other Images in This Article
Show More
Copyright and Terms & Conditions
© 2026. The Author(s). Published by the American Astronomical Society.