Image Details
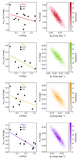
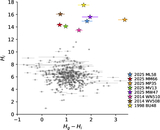
Caption: Figure 7.
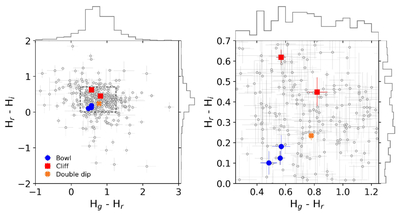
Color–color diagram for objects with N ≥ 8 measurements per band. The left panel shows the full distribution, while the right panel presents a zoomed-in view of the region highlighted by the dashed rectangle. Black points represent the full dataset, with error bars reflecting photometric uncertainties. Objects in common with N. Pinilla-Alonso et al. (2025) are highlighted with colored markers according to their spectral classification: water-rich (Bowl; blue circles), CO2-rich (Double dip; orange crosses), and organic-rich (Cliff; red squares).
Other Images in This Article
Show More
Copyright and Terms & Conditions
© 2026. The Author(s). Published by the American Astronomical Society.
Copyright ©
2026 Astronomy Image Explorer. All Rights Reserved.