Image Details
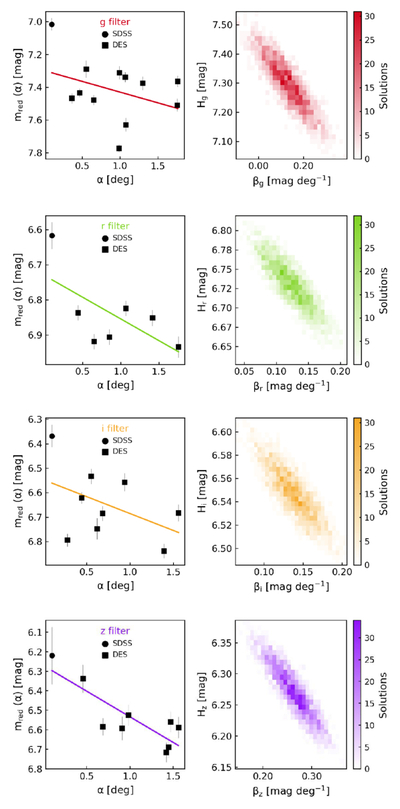
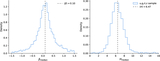
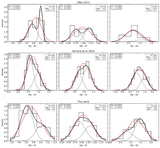
Caption: Figure 4.
Example phase-curve fitting for a single TNO 2007 RW10 across different filters. Left panels: observed reduced magnitudes vs. phase angle for different surveys (markers indicate survey origin), with the median linear fit overplotted with a solid line. Right panels: 2D histogram of 2000 Monte Carlo iterations of the linear fit, showing the distribution of phase slope (β) vs. absolute magnitude (H).
Other Images in This Article
Show More
Copyright and Terms & Conditions
© 2026. The Author(s). Published by the American Astronomical Society.
Copyright ©
2026 Astronomy Image Explorer. All Rights Reserved.