Image Details
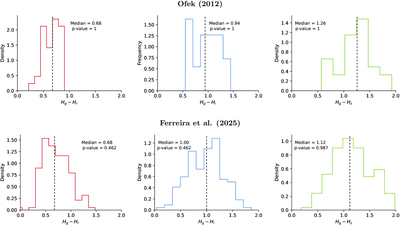
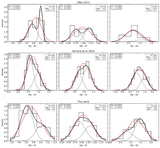
Caption: Figure 8.
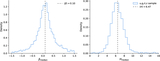
Histograms of absolute colors (Hg − Hi, Hg − Hr, and Hg − Hz) from E. O. Ofek (2012) (top) and F. S. Ferreira et al. (2025) (bottom), shown separately. In each panel, the p-value of the Hartigan dip test is indicated. In all cases, the p-values are well above 0.05, indicating that unimodality cannot be rejected. While Hg − Hi shows the strongest visual hint of bimodality, it remains statistically consistent with a unimodal distribution.
Other Images in This Article
Show More
Copyright and Terms & Conditions
© 2026. The Author(s). Published by the American Astronomical Society.
Copyright ©
2026 Astronomy Image Explorer. All Rights Reserved.