Image Details
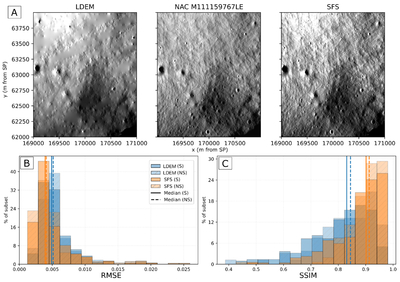
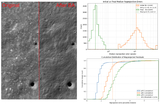
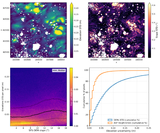
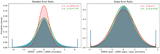
Caption: Figure 14.
SDEM renderings at 5 m pix−1 show higher fidelity to LROC NAC images than their LDEM counterparts, as shown by the example in panel (A). A comparison of the root mean square error (RMSE, B) and structural similarity (SSIM, C) metrics for ∼380 NAC images (Selected, S, and Not Selected, NS) across all regions also shows the improved predictive power of the SDEMs for terrain analyses and operational planning.
Other Images in This Article
Show More
Copyright and Terms & Conditions
© 2026. The Author(s). Published by the American Astronomical Society.
Copyright ©
2026 Astronomy Image Explorer. All Rights Reserved.