Image Details
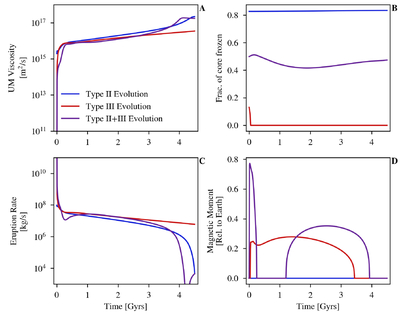
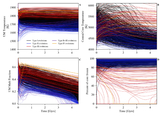
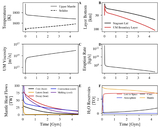
Caption: Figure 22.
Time evolution of select key core and mantle variables for a sample Type II evolution (blue), a sample Type III evolution (red) and a sample evolution that is both Type II and Type III (purple). The top-left panel plots the upper mantle viscosity over time; the bottom-left panel plots the eruption rate over time; the top-right panel plots the fraction of the core that’s frozen over time; the bottom-right panel plots the magnetic moment over time. The parameter values for each of these sample evolutions are given in Table 10.
Other Images in This Article
Show More
Copyright and Terms & Conditions
© 2026. The Author(s). Published by the American Astronomical Society.
Copyright ©
2026 Astronomy Image Explorer. All Rights Reserved.