Image Details
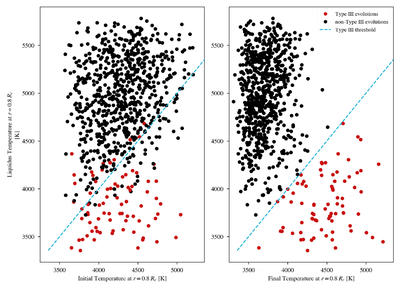
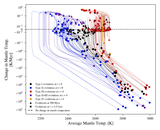
Caption: Figure 20.
These two panels show the thermal state of the core for Type III (red) and non–Type III (black) at the beginning (left panel) and end (right panel) of the evolution. Each simulation is shown in a space defined by the liquidus temperature at 80% of the core’s radius and the actual temperature at 80% of the core’s radius. The cyan dashed line represents the threshold for a simulation to be considered Type III, ending with an inner core that is <80% of the core’s radius.
Other Images in This Article

Show More
Copyright and Terms & Conditions
© 2026. The Author(s). Published by the American Astronomical Society.
Copyright ©
2026 Astronomy Image Explorer. All Rights Reserved.