Image Details
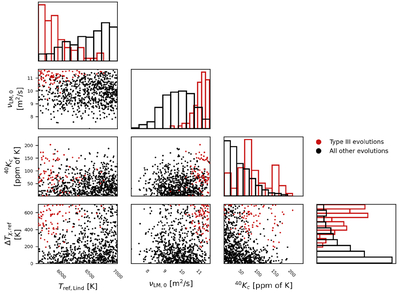
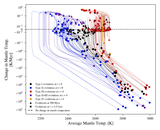
Caption: Figure 19.
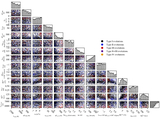
The scatter plots in this corner plot show where every simulation lies in a subset of the full parameter space defined by four variables: the reference viscosity for the lower mantle (νLM,0), the amount of 40K in the core (40Kc in units of ppm of K in the core), the liquidus depression (ΔTχ,ref), and the reference core liquidus temperature (Tref,Lind). The histograms show the distribution of Type III evolutions (red) and non–Type III evolutions (black) marginalized over all parameters except for each parameter below them (or to the left, in the case of the initial mantle temperature). Note that the lower mantle reference viscosity, the liquidus depression, and the reference liquidus temperature appear to exert the strongest control on whether a simulation will end with a mostly frozen core.
Other Images in This Article
Show More
Copyright and Terms & Conditions
© 2026. The Author(s). Published by the American Astronomical Society.