Image Details
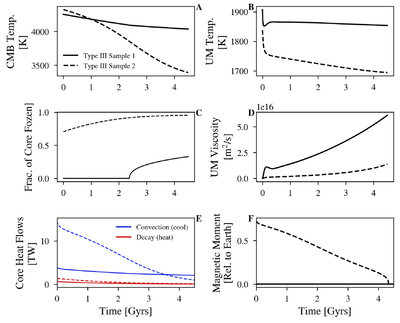
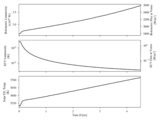
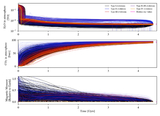
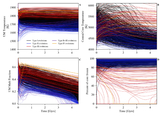
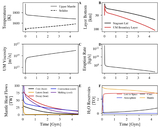
Caption: Figure 17.
Time evolution of select key core and mantle variables for two sample Type III evolutions. Variables for sample evolution 1 are always plotted with a solid line, and variables for sample evolution 2 are always plotted with a dashed line. Panel (A) plots the temperature at the core–mantle boundary over time; panel (B) plots the upper mantle temperatures over time; panel (C) shows the fraction of the core frozen over time; panel (D) shows the upper mantle viscosity; panel (E) shows the heat source (radioactive decay in red) and heat sink (convective cooling in blue) for the core of each sample evolution; and panel (F) shows the magnetic field strength relative to present-day Earth’s over time. Parameter choices for this evolution can be found in Table 9.
Other Images in This Article
Show More
Copyright and Terms & Conditions
© 2026. The Author(s). Published by the American Astronomical Society.