Image Details
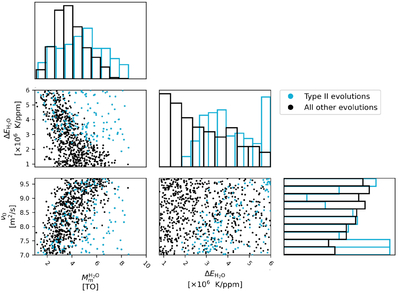
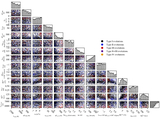
Caption: Figure 13.
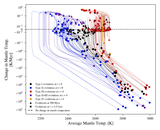
The scatter plots show where every simulation lies in a subset of the full parameter space defined by three variables: the initial amount of water in the mantle (﹩{M}_{m}^{{{\rm{H}}}_{2}{\rm{O}}}﹩), the strength of coupling between mantle water content and viscosity (﹩{\rm{\Delta }}{E}_{{{\rm{H}}}_{2}{\rm{O}}}﹩), and the reference viscosity (ν0). The histograms show the distribution of Type II evolutions (blue) and non–Type II evolutions (black) marginalized over all parameters except for each parameter below them (or to the left in the case of the eruption efficiency). Note that many of the simulations that exhibit Type II behavior (the blue points) carve out a region in the ﹩{\rm{\Delta }}{E}_{{{\rm{H}}}_{2}{\rm{O}}}﹩–﹩{M}_{m}^{{{\rm{H}}}_{2}{\rm{O}}}﹩ space that is mostly distinct, despite some overlap, with a Type I band. While ﹩{M}_{m}^{{{\rm{H}}}_{2}{\rm{O}}}﹩ has a higher feature importance score, ﹩{\rm{\Delta }}{E}_{{{\rm{H}}}_{{\rm{2O}}}}﹩ has a histogram distribution for Type II evolutions that is more distinguishable from that for Type I evolutions, highlighting the water-mantle viscosity coupling as a key driver of Type II behavior.
Other Images in This Article
Show More
Copyright and Terms & Conditions
© 2026. The Author(s). Published by the American Astronomical Society.