Image Details
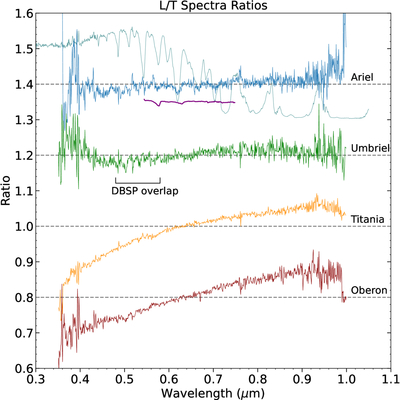
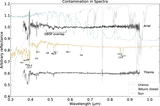
Caption: Figure 8.
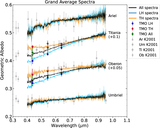
The grand average LH spectra of each moon divided by the grand average TH spectra, binned by 2 pixels and offset in ±0.2 increments. We have plotted an arbitrarily scaled and offset albedo spectrum of Uranus in light blue (E. Karkoschka 1998) behind the ratio spectrum of Ariel in order to emphasize which “features” are likely spurious. A reflectance spectrum of Ganymede displaying absorption features from dense-phase O2 is shown below the Ariel spectrum in purple (J. R. Spencer et al. 1995).
Other Images in This Article
Copyright and Terms & Conditions
© 2026. The Author(s). Published by the American Astronomical Society.
Copyright ©
2026 Astronomy Image Explorer. All Rights Reserved.