Image Details
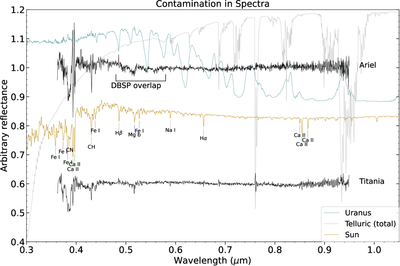
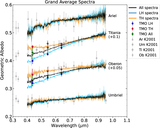
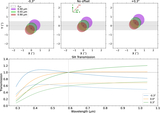
Caption: Figure B1.
A demonstration of false narrow spectral features in our data. The grand average “all” spectra of Ariel and Titania, in black, have been divided by a spline fit to flatten them for comparison purposes. We have plotted the albedo of Uranus in blue (E. Karkoschka 1998), the solar spectrum divided by a 5777 K blackbody in gold (O. M. Coddington et al. 2023), a generic telluric absorption spectrum from the Planetary Spectrum Generator in gray (G. L. Villanueva et al. 2022), and have annotated the region of overlap/splicing between the two spectral channels of DBSP, which can produce the false absorption features seen in the Ariel spectrum. All scaling and vertical positioning of spectra in this figure are arbitrary and for illustrative purposes only.
Other Images in This Article
Copyright and Terms & Conditions
© 2026. The Author(s). Published by the American Astronomical Society.