Image Details
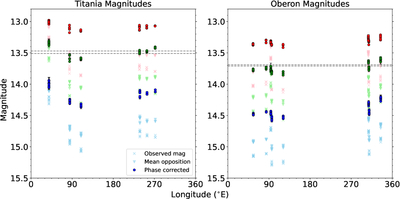
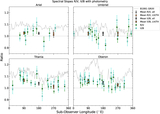
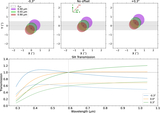
Caption: Figure 3.
The measured magnitudes versus sub-observer longitude of the TMO photometry for Titania and Oberon. Blue, green, and red colors (bottom, middle, and top) correspond to the B, V, and R filters, respectively. The pale X markers for each filter are the originally measured magnitudes for each image, the pale triangles are the mean opposition magnitudes, and the darker colored circles with error bars are the magnitudes corrected to zero phase angle. The horizontal lines are the maximum and minimum V-band opposition magnitudes from Table 4 of E. Karkoschka (2001).
Other Images in This Article
Copyright and Terms & Conditions
© 2026. The Author(s). Published by the American Astronomical Society.
Copyright ©
2026 Astronomy Image Explorer. All Rights Reserved.