Image Details
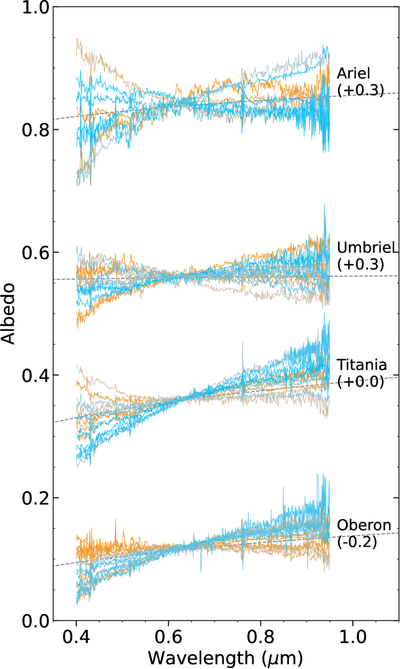
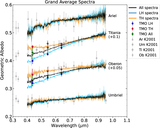
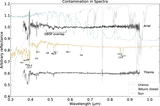
Caption: Figure 2.
All of our acquired spectra for the Uranian moons (Tables 1 and 2). Each spectrum was normalized to the K2001 geometric albedo for that body at 0.63 μm (Section 3), then offset by the listed factor. Spectra are shaded by longitude: blue spectra are on the leading hemisphere, orange spectra are on the trailing hemisphere, and spectra with less saturated colors are intermediate longitudes. The photometric models of K2001 for each body are plotted as gray dashed lines behind the spectra. Spectra are binned by 3 pixels for clarity.
Other Images in This Article
Copyright and Terms & Conditions
© 2026. The Author(s). Published by the American Astronomical Society.
Copyright ©
2026 Astronomy Image Explorer. All Rights Reserved.