Image Details
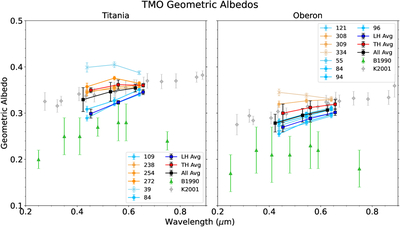
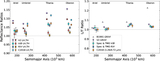
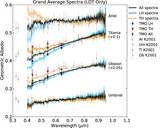
Caption: Figure 4.
The calculated geometric albedo spectra from the TMO photometry for Titania and Oberon. The square points with black error bars (offset in wavelength by ±0.015 μm for legibility) are the average leading hemisphere, average trailing hemisphere, and overall average geometric albedo spectra for each body. The gray diamond markers extending across the whole wavelength range are the geometric albedo spectra from K2001, and the green triangle markers are the Voyager-based geometric albedo spectra from B. Buratti et al. (1990). The label for each spectrum in the legend indicates the sub-observer longitude. In both panels, data points that were not included in the geometric albedo averages are plotted with X markers. The longitude 309 points for Oberon are hidden behind several leading-hemisphere measurements.
Other Images in This Article
Copyright and Terms & Conditions
© 2026. The Author(s). Published by the American Astronomical Society.