Image Details
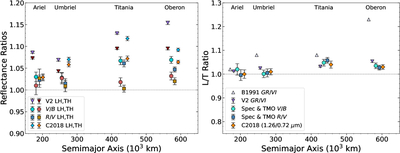
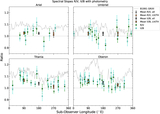
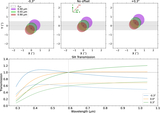
Caption: Figure 7.
Left panel: the reflectance ratios of the leading hemisphere and trailing hemisphere for each moon, for different datasets and spectral ranges (Table 5). The different datasets for each moon are separated in semimajor axis (on the X-axis) for legibility. Our calculated averages of the Voyager 2 GR/VI longitudinal color scans from B1991 are plotted with purple (LH) and dark red (TH) triangles and labeled “V2.” The measured reflectance ratios in our spectra and photometry are plotted with turquoise (LH) and red (TH) circles for V/B, and dark-blue (LH) and brown (TH) squares for R/V. NIR reflectance ratios from R. J. Cartwright et al. (2018; C2018) are plotted with sky blue (LH) and orange (TH) diamonds. The global average colors are omitted from this plot for clarity. Right panel: the leading/trailing ratios of the reflectance ratios for each moon, for different datasets (Table 6). L/T ratios of the Voyager 2 GR/VI colors originally reported in Table IV of B1991 are plotted with lavender triangles; our “V2” L/T averages in GR/VI are plotted with purple triangles; our L/T ratios of the V/B and R/V colors in our spectra and photometry are plotted with turquoise circles and dark-blue squares; and NIR L/T spectral slope ratios from C2018 are plotted with orange diamonds.
Other Images in This Article
Copyright and Terms & Conditions
© 2026. The Author(s). Published by the American Astronomical Society.