Image Details
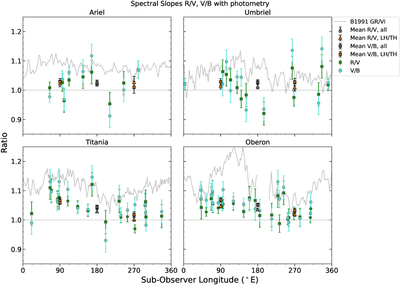
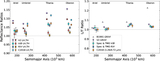
Caption: Figure 6.
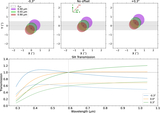
The spectral slopes (reflectance ratios) of our spectra and photometry, measured in R/V and V/B, plotted as a function of sub-observer longitude. All error bars are 1σ errors. Turquoise circles are V-band/B-band ratios for each spectrum; green squares are the same for R/V ratios. The average slopes of the leading (0°–180°) and trailing (181°–360°) hemispheres are marked with orange Xs and triangles at 90° and 270°, respectively, and the average slopes of all spectra for each body are marked with gray Xs and triangles at 180°. The averages for Titania and Oberon include the TMO photometry measurements. The gray curves are Voyager 2 GR/VI color ratio longitudinal scans from B. J. Buratti & J. A. Mosher (1991); as discussed in the text, these curves are not directly comparable to our measurements, and are simply included for visualization purposes.
Other Images in This Article
Copyright and Terms & Conditions
© 2026. The Author(s). Published by the American Astronomical Society.