

Image Details
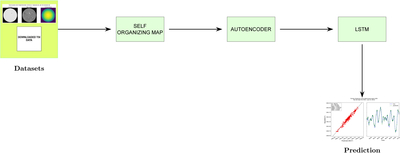
Caption: Figure 6.
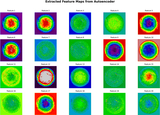
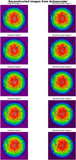
End-to-end SOM–AE–LSTM pipeline. Solar disk observations (continuum image, unsigned magnetogram, and μ map) are clustered pixel-wise by the SOM into a 400-node cluster-index map, compressed by the convolutional AE into a 32-dimensional feature vector zt via global-average pooling, concatenated with the contemporaneous TSI measurement, and processed by the LSTM to produce multihorizon TSI forecasts. Training proceeds sequentially through the three stages; all parameters are estimated from training-period data only.
Other Images in This Article
Show More
Copyright and Terms & Conditions
© 2026. The Author(s). Published by the American Astronomical Society.

Copyright ©
2026 Astronomy Image Explorer. All Rights Reserved.
