

Image Details
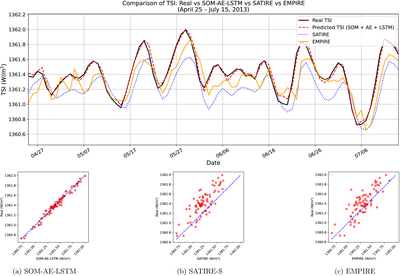
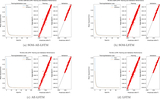
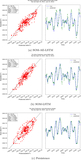
Caption: Figure 10.
Top: SOM–AE–LSTM 24 hr forecast (red dashed) against observed TIM/SORCE TSI (black), with SATIRE-S and EMPIRE daily reconstructions overlaid, test period 25 April–15 July 2013. Bottom: observed vs. modeled scatter for each. The machine learning forecast operates at 6 hourly cadence; the physical reconstructions are daily means. Metrics in Table 5 (blue rows).
Other Images in This Article
Show More
Copyright and Terms & Conditions
© 2026. The Author(s). Published by the American Astronomical Society.

Copyright ©
2026 Astronomy Image Explorer. All Rights Reserved.
