

Image Details
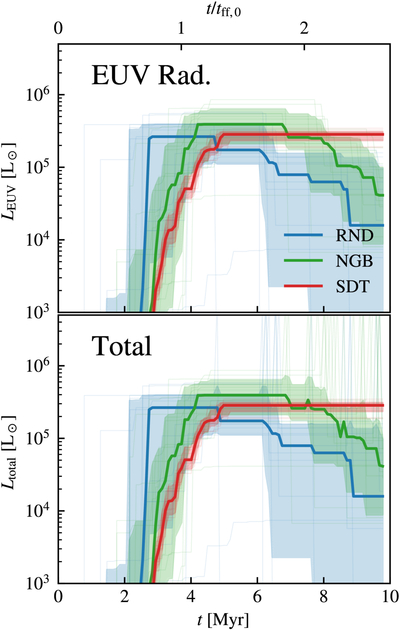
Caption: Figure 8.
Feedback luminosity as a function of time in the simulated clouds (M05R6). The top panel plots the evolution of EUV (13.6–100 eV) radiation luminosity, while the bottom panel plots the evolution of total feedback luminosity as a summation of EUV radiation, stellar wind, and supernovae (SNe). The solid curves and shaded regions show the median and 16th–84th percentile range for the 15 runs with different random seeds. The transparent curves show the results for each individual run. For the SN luminosity, we assume each SN releases 1051 erg with 1000 yr to calculate its luminosity in the dimension of power (energy per time).
Other Images in This Article
Show More
Copyright and Terms & Conditions
© 2026. The Author(s). Published by the American Astronomical Society.

