

Image Details
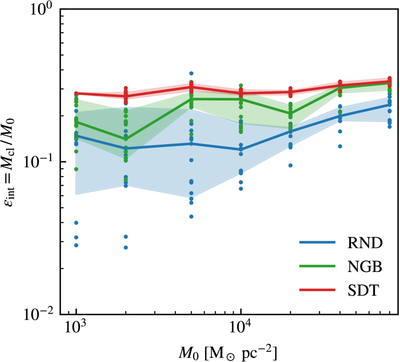
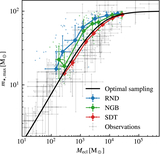
Caption: Figure 9.
Integrated SFE as a function of cloud initial mass. The solid curves and shaded regions show the median and 16th–84th percentile range for the 15 runs with different random seeds. The dots show the results for each individual run. The SDT runs show the minimized run-to-run variation and highest integrated SFE due to the ordered star formation.
Other Images in This Article
Show More
Copyright and Terms & Conditions
© 2026. The Author(s). Published by the American Astronomical Society.

Copyright ©
2026 Astronomy Image Explorer. All Rights Reserved.
