

Image Details
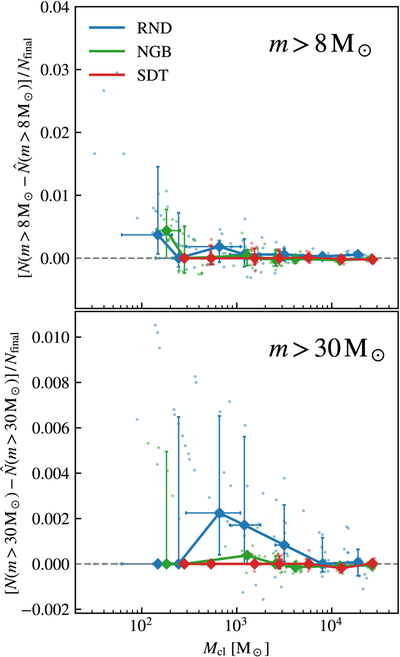
Caption: Figure 5.
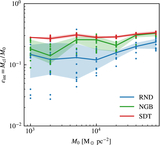
The difference between number of massive stars in the simulation, N, and that predicted by the optimal sampling theory, ﹩\hat{N}﹩, normalized by the total number of stars formed in a simulation, Nfinal. Each dot is the result of one simulated clouds, and the error bars show the medians and 16th–84th percentile ranges. The larger marker points with error bars present the median value and 16th and 84th percentiles for simulated clouds with different IC.
Other Images in This Article
Show More
Copyright and Terms & Conditions
© 2026. The Author(s). Published by the American Astronomical Society.

Copyright ©
2026 Astronomy Image Explorer. All Rights Reserved.
