

Image Details
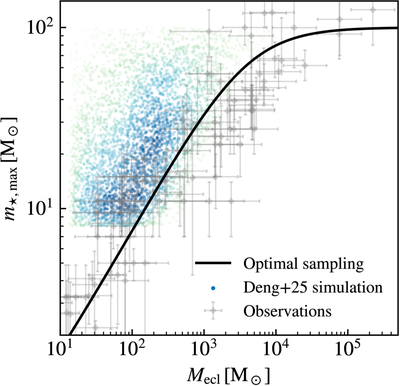
Caption: Figure 1.
Most-massive stellar mass to embedded cluster mass (m⋆,max–Mecl) relation. The black curve is the theoretical relation predicted by the optimal sampling following the deviations in Z. Yan et al. (2023). Blue dots are the results from the simulation of Y. Deng et al. (2025) using the Y. Deng et al. (2024) version RIGEL model, color-coded by the normalized density in log-space estimated by a Gaussian kernel. In this simulation, m⋆,max is allowed to exceed Mecl, as the sampled massive star mass is not equal to the mass of star particles. Gray crosses are the FL observed young clusters (age < 5 Myr) from H. Kirk & P. C. Myers (2011), C. Weidner et al. (2013), and I. W. Stephens et al. (2017).
Other Images in This Article
Show More
Copyright and Terms & Conditions
© 2026. The Author(s). Published by the American Astronomical Society.

