

Image Details
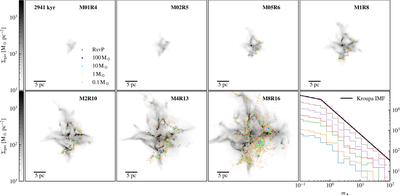
Caption: Figure 3.
Overview of the simulations of isolated clouds. The first through seventh panels are the snapshots at 3 Myr of the seven clouds run with SDT method. The background color maps are the surface density projection, while colorful dots with different sizes are the stars with different masses. The black dots represents the RsvPs. The last panel shows the final IMF of each simulation compared with the canonical Kroupa IMF.
Other Images in This Article
Show More
Copyright and Terms & Conditions
© 2026. The Author(s). Published by the American Astronomical Society.

Copyright ©
2026 Astronomy Image Explorer. All Rights Reserved.
