

Image Details
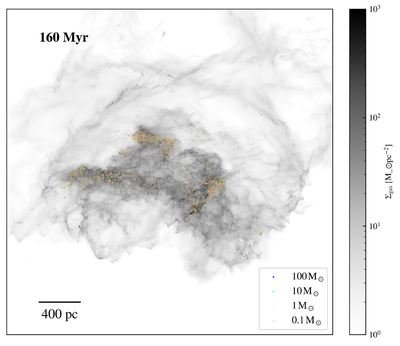
Caption: Figure 10.
Overview of the merger system at 160 Myr simulation time. The result is obtained with the SDT model. The background gray-scale map is the gas surface density projected along the x-axis, while the colorful dots with different sizes are the young stars (age <5 Myr) with different masses.
Other Images in This Article
Show More
Copyright and Terms & Conditions
© 2026. The Author(s). Published by the American Astronomical Society.

Copyright ©
2026 Astronomy Image Explorer. All Rights Reserved.
