

Image Details
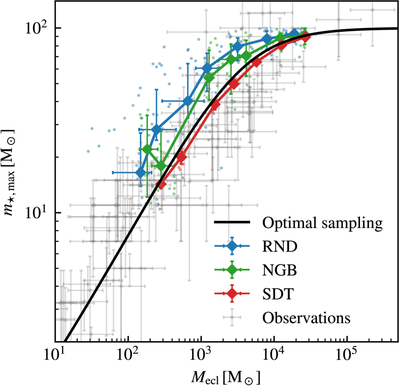
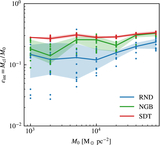
Caption: Figure 4.
Most-massive stellar mass to embedded cluster mass (m⋆,max–Mecl) relation in the simulations. Blue, green, and red dots are the results of isolated cloud simulations using random sampling (RND), neighbor-based sampling (NGB), and SDT sampling. Gray crosses are the observational data.
Other Images in This Article
Show More
Copyright and Terms & Conditions
© 2026. The Author(s). Published by the American Astronomical Society.

Copyright ©
2026 Astronomy Image Explorer. All Rights Reserved.
