

Image Details
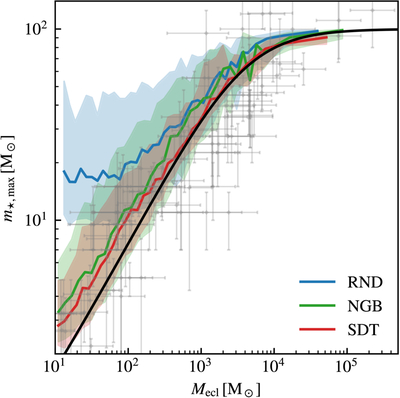
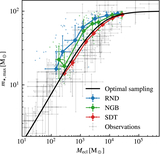
Caption: Figure 12.
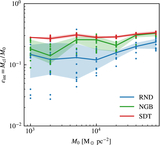
Most-massive stellar mass to embedded cluster mass (m⋆,max–Mecl) relation in the simulations. The clusters are identified by the 4D FoF method. Blue, green, and red curves are the median results for simulations using RND, NGB, and SDT methods, respectively. The shaded regions are the 16th–84th percentile ranges. Gray crosses are the observational data.
Other Images in This Article
Show More
Copyright and Terms & Conditions
© 2026. The Author(s). Published by the American Astronomical Society.

Copyright ©
2026 Astronomy Image Explorer. All Rights Reserved.
