Image Details
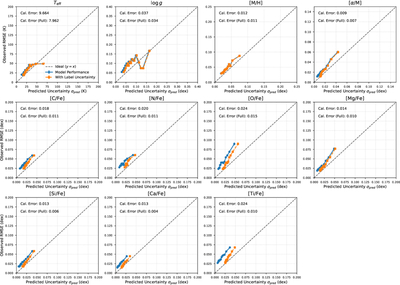
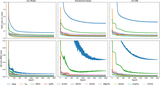
Caption: Figure 8.
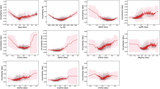
Calibration curves comparing the predicted uncertainty (σpred, x-axis) with the observed rms error (y-axis). The orange points represent the observed error after correcting for the intrinsic APOGEE label uncertainty. The dashed line indicates perfect calibration (y = x). Points on the line indicate accurate calibration (e.g., Teff). Points below the line (e.g., high-uncertainty ﹩\mathrm{log}g﹩) indicate conservative/overestimated uncertainty. Points above the line (e.g., high-uncertainty abundances) indicate overconfidence/underestimated uncertainty. The specific behavior of ﹩\mathrm{log}g﹩ at the high end is associated with the main-sequence population.
Other Images in This Article
Show More
Copyright and Terms & Conditions
© 2026. The Author(s). Published by the American Astronomical Society.