Image Details
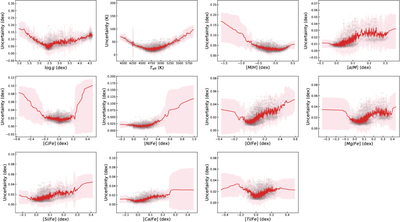
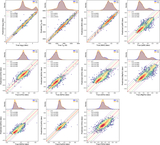
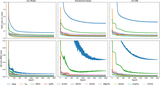
Caption: Figure 7.
The dependence of the model-predicted uncertainty on the stellar parameters for the test set. The background gray hexbins display the number density of stars on a logarithmic scale. The red solid line with markers represents the median predicted uncertainty calculated in 20 equidistant bins across the parameter range. The red shaded region indicates the 68% interquartile range (16th–84th percentiles) of the uncertainty distribution within each bin.
Other Images in This Article
Show More
Copyright and Terms & Conditions
© 2026. The Author(s). Published by the American Astronomical Society.
Copyright ©
2026 Astronomy Image Explorer. All Rights Reserved.