Image Details
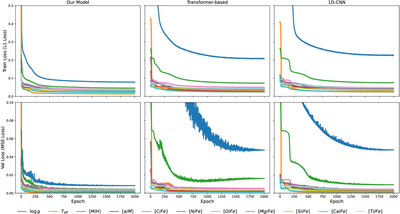
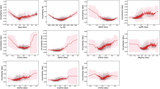
Caption: Figure 10.
Diagnostic learning curves over training epochs for the three evaluated architectures. Top row: training loss, measured in L1 loss (MAE), which serves as the actual optimization objective during backpropagation to ensure robustness against label outliers. Bottom row: validation loss, measured in MSE, which is recorded to strictly monitor convergence stability and variance. From left to right, the columns correspond to our proposed BMA model, the standard transformer, and the 1D CNN baseline. The y-axis in the bottom panels is truncated at an MSE value of 0.1 to emphasize the convergence behavior during the plateau phase.
Other Images in This Article
Show More
Copyright and Terms & Conditions
© 2026. The Author(s). Published by the American Astronomical Society.