Image Details
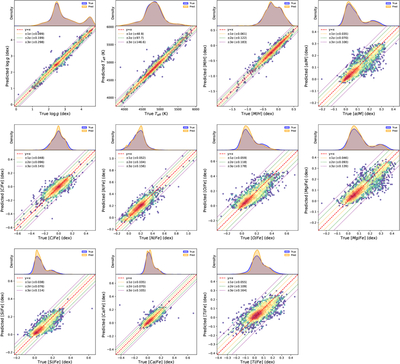
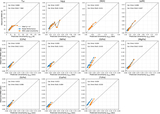
Caption: Figure 4.
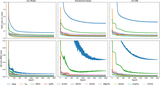
Comparison between the reference APOGEE labels (x-axis) and the model-predicted stellar parameters (y-axis) for the validation set. The panels display the results for 11 stellar labels, including atmospheric parameters (﹩\mathrm{log}g﹩, Teff, [M/H]) and individual elemental abundances. In the main panels, the color density represents the stellar number density on a logarithmic scale, highlighting both the dense core regions and the sparse outliers. The red dashed line indicates the identity relation (y = x). The dotted lines (orange, green, and purple) represent the ±1σ, ±2σ, and ±3σ dispersion intervals derived from the residuals, respectively. The top panels show the marginal probability density distributions of the ground truth (blue) and predicted values (orange), demonstrating the consistency of the global distributions.
Other Images in This Article
Show More
Copyright and Terms & Conditions
© 2026. The Author(s). Published by the American Astronomical Society.