Image Details
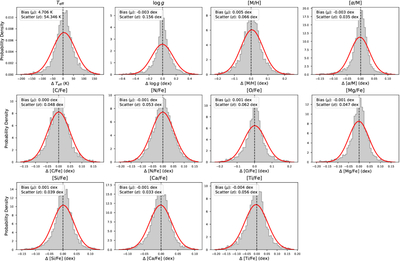
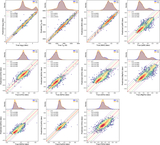
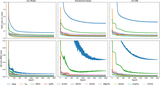
Caption: Figure 5.
Residual distributions of the stellar labels estimated by the model on the test set. The residuals are defined as ΔX = Xpred − Xlabel, where Xlabel refers to the APOGEE reference values. In each panel, the gray histogram displays the density distribution of the residuals, and the solid red curve represents the best-fit Gaussian profile. The vertical dashed line marks the position of zero bias. The statistical metrics, including the mean bias (μ) and the standard deviation (σ, representing the prediction precision), are annotated in the top-left corner of each panel.
Other Images in This Article
Show More
Copyright and Terms & Conditions
© 2026. The Author(s). Published by the American Astronomical Society.
Copyright ©
2026 Astronomy Image Explorer. All Rights Reserved.