Image Details
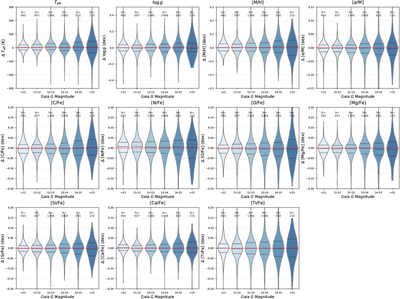
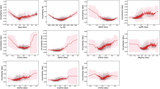
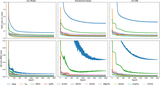
Caption: Figure 6.
Violin plots showing the distribution of residuals as a function of Gaia G magnitude (a proxy for the SNR of the input XP spectra). The horizontal dashed red line represents zero bias. The internal dashed lines within each violin indicate the quartiles (25th, median, 75th). The number of stars in each magnitude bin is annotated at the top.
Other Images in This Article
Show More
Copyright and Terms & Conditions
© 2026. The Author(s). Published by the American Astronomical Society.
Copyright ©
2026 Astronomy Image Explorer. All Rights Reserved.