Image Details
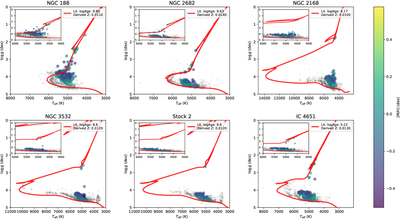
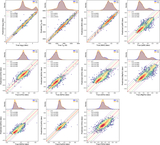
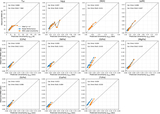
Caption: Figure 15.
Kiel diagrams (Teff vs. ﹩\mathrm{log}g﹩) for six representative open clusters, demonstrating the physical fidelity of the derived parameters. The light-gray background points represent the entire cluster membership, derived specifically from the Gaia DR3 GSP-Phot PHOENIX library to avoid artificial discontinuities, visualizing the complete evolutionary structure. The overlaid colored points represent the high-fidelity subsample derived from our BMA model, color coded by the predicted metallicity ([M/H]). This visualization explicitly highlights the deliberate truncation of the warm upper main sequence (Teff ≳ 5800 K). The solid red curves represent the best-matching PARSEC theoretical isochrones, anchored by literature age priors (logAge) and dynamically scaled by our model’s median predicted metallicity (derived Z). The inset panels provide a zoomed-in view of the 4000–6000 K regime, confirming that our model’s predictions robustly reconstruct well-defined lower main sequences and red clump features that naturally align with theoretical evolutionary tracks.
Other Images in This Article
Show More
Copyright and Terms & Conditions
© 2026. The Author(s). Published by the American Astronomical Society.