Image Details
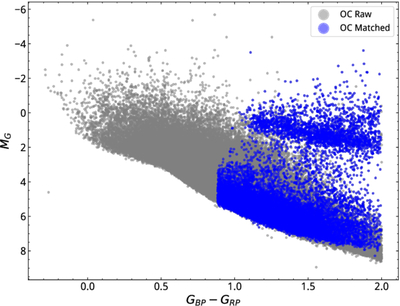
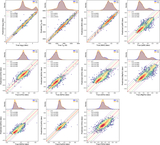
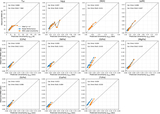
Caption: Figure 14.
Observational color–magnitude diagrams (MG vs. GBP − GRP) comparing the parent sample of 84,314 cluster members (gray background) with the final high-fidelity application subset of 20,032 stars (blue points). The selection deliberately removes the warm upper main sequence to prevent out-of-distribution inference, while completely preserving the robust cool dwarf and giant populations.
Other Images in This Article
Show More
Copyright and Terms & Conditions
© 2026. The Author(s). Published by the American Astronomical Society.
Copyright ©
2026 Astronomy Image Explorer. All Rights Reserved.